
16. Performance Metrics — What the Numbers Mean
“Without data, you’re just another person with an opinion. With the wrong data, you’re a person with a confident opinion.”— after W. Edwards Deming
The story: the thermometer in the oven
Section titled “The story: the thermometer in the oven”A friend bakes bread and it keeps coming out dense. She buys an oven thermometer. The dial on the oven says 220 °C. The thermometer says 175 °C. The oven had been lying for years.
Then she makes a second mistake: she puts the thermometer right next to the heating element, where it reads 260 °C, and turns the oven down. Now the bread is raw in the middle.
Performance metrics are thermometers. They are wonderful, and they are only as good as where you put them and whether you know what they measure. A Lighthouse score on your laptop is a thermometer next to the heating element. Field data from real phones is the thermometer in the middle of the oven. This chapter teaches you what each number measures, where it should sit, what “good” means, and — using the author’s own audit of her glass UI kit as the case study — how to look at a table of numbers and immediately know which ones matter.
Why speed matters — honestly
Section titled “Why speed matters — honestly”You’ve heard the statistics. Let’s handle them like a senior engineer.
“Amazon found every 100 ms of latency cost them 1% in sales.” This is the most-quoted performance statistic in history, and its provenance is thin: it traces back to remarks and slides from former Amazon engineers in the mid-2000s, about experiments on a very different web. No published study, no methodology, no recent replication. It may well have been true for Amazon at the time. It is folklore for your purposes: don’t put it in a slide as if it were a law of nature.
“Google found 500 ms extra latency dropped traffic by 20%.” Also from a mid-2000s talk, about search results pages. Same caveat.
Better evidence exists:
- Deloitte’s “Milliseconds Make Millions” (2020, commissioned by Google) studied mobile sites of several dozen brands across retail, travel, luxury and lead generation, and found that a 0.1-second improvement in mobile site speed metrics correlated with meaningful increases in progression through funnels and in conversion — on the order of single-digit to ~10% gains depending on vertical. It’s correlational and commissioned by an interested party, but it’s a published study with a methodology.
- Published case studies on web.dev, written by the companies themselves, with before/after metrics: Indian sites among them, such as large news and travel-booking platforms reporting improved engagement and conversions after fixing INP and LCP. Vodafone reported that an LCP improvement of roughly a third came with an increase in sales of several percent in an A/B test. These are self-reported and selected for success (nobody publishes “we got faster and nothing happened”), but they’re specific and attributable.
The honest framing for your leadership: speed is a quality attribute users feel and that correlates with business outcomes in many published cases; the size of the effect depends on your product, so measure your own. Better still, run an experiment — slow down a small percentage of traffic by 200 ms and measure — if your organization has the stomach for it.
And beyond business: speed is access. A page that needs a flagship phone and fast Wi-Fi to work excludes the people Priya represents. Speed is also an SEO input, though a modest one (Chapter 22).
The metrics, one by one
Section titled “The metrics, one by one”TTFB — Time to First Byte
Section titled “TTFB — Time to First Byte”What: from the start of navigation until the first byte of the HTML response arrives. Includes redirects, DNS, connection, TLS, the request’s journey, and the server’s thinking time (Chapter 5’s timing breakdown, all of it). Good: ≤ 0.8 s; poor: > 1.8 s (at p75). Users feel: nothing directly — a blank screen and a progress bar. But TTFB is the floor under every other loading metric. Usually caused by: distance (no CDN), slow server rendering (SSR doing too much, slow database), redirects, cold starts.
FCP — First Contentful Paint
Section titled “FCP — First Contentful Paint”What: when the browser first paints any content — text, an image, a non-white canvas, SVG. Good: ≤ 1.8 s; poor: > 3.0 s. Users feel: “something is happening.” Caused by: TTFB + render-blocking CSS and scripts (Chapter 9) + big HTML before first content.
LCP — Largest Contentful Paint
Section titled “LCP — Largest Contentful Paint”What: when the largest content element in the viewport finished rendering — the moment the main content probably appeared. One of the three Core Web Vitals. Good: ≤ 2.5 s; poor: > 4.0 s.
Eligible elements: <img> (including images inside <svg>), the poster image or first frame of <video>, elements with a CSS background-image loaded via url(), and block-level elements containing text. The browser keeps reporting new, larger candidates as the page loads, and stops at the first user interaction (tap, click, keypress — not scroll on all browsers). Heuristics exclude some things: elements with zero opacity, full-viewport images that look like backgrounds, and low-information “placeholder” images.
A <canvas> is not an LCP candidate. Neither is WebGL content drawn into one. That’s why, in the author’s audit, the wallpaper canvas — visually the biggest thing on screen — isn’t the LCP element, and the intro paragraph is. That’s a measurement quirk, not proof the canvas is fast: a page whose real hero is a canvas can show a great LCP while users stare at an empty background. Remember that when you read LCP for graphics-heavy pages.
LCP sub-parts. LCP for an image decomposes into four parts, and this decomposition is the single most useful diagnostic idea in loading performance:
- TTFB — until the HTML starts arriving.
- Resource load delay — from TTFB until the browser starts fetching the LCP resource. This is a discovery problem (Chapter 9): lazy-loading, CSS backgrounds, JS-inserted images, low priority.
- Resource load duration — downloading the LCP resource. A bytes and bandwidth problem: image too big, wrong format, no CDN.
- Element render delay — from downloaded until painted. A main thread problem: render-blocking CSS/JS still pending, client-side rendering hasn’t created the element yet, a long task in the way.
On a well-optimized page, the two “delay” parts are small and most time goes to TTFB and the download itself. For text LCP elements, there’s no resource; LCP is TTFB plus render delay (which includes web-font loading if text is hidden while fonts load).
Try it: build an LCP out of its four parts
LCP = TTFB + resource load delay (until the browser even starts fetching the LCP image) + resource load duration (downloading it) + element render delay (downloaded → painted). On a healthy page the two "delay" parts are close to zero.
CLS — Cumulative Layout Shift
Section titled “CLS — Cumulative Layout Shift”What: how much visible content moves unexpectedly. Each layout shift gets a score = impact fraction (how much of the viewport the moving elements touched, before and after) × distance fraction (how far they moved, relative to the viewport). Shifts within 500 ms of a user input (tap, key) are excluded — they’re expected. Shifts are grouped into session windows (shifts less than 1 s apart, a window lasting at most 5 s); CLS is the largest session window’s total. Core Web Vital. Good: ≤ 0.1; poor: > 0.25.
Users feel: reading, then losing their place; tapping, then hitting the wrong thing. It’s one of the most hated experiences on the mobile web.
Usually caused by: images and embeds without dimensions; ads and banners injected above content; web fonts swapping with different metrics; content inserted by JS after load (cookie banners pushing the page down instead of overlaying); animations of layout properties (animate transform, which doesn’t count as a layout shift).
Try it: make the article jump
Layout-shift score for this demo: —
What you'd see: without reserved space the paragraph and button jump down by the image's height. The Layout Instability API reports a shift with value ≈ impact fraction × distance fraction (for a big shift in a small frame, often 0.1–0.4 — “poor” on its own). With space reserved the score is exactly 0. Note: because you clicked a button, this shift is flagged hadRecentInput and would be excluded from the page's real CLS; a genuinely late image has no such excuse.
INP — Interaction to Next Paint
Section titled “INP — Interaction to Next Paint”What: the responsiveness of the page to user interactions over the whole visit. For each click, tap or key press, measure from the input to the next frame painted after the handlers run. Each interaction’s latency has three parts:
- Input delay — waiting for the main thread to be free (a long task was running).
- Processing duration — running your event handlers.
- Presentation delay — style, layout, paint, compositing until the next frame shows the result.
The page’s INP is roughly the worst interaction latency during the visit — precisely, a high percentile: for pages with many interactions, the browser ignores one highest outlier per 50 interactions so a single fluke doesn’t define the page. INP replaced First Input Delay (FID) as a Core Web Vital in March 2024. FID measured only the input delay of the first interaction — easy to pass while the page was still horrible to use. Good: ≤ 200 ms; poor: > 500 ms.
Users feel: “the button didn’t work,” double-taps, rage clicks. Caused by: long tasks (hydration, big renders, third-party scripts), heavy handlers, huge DOM updates, layout thrashing in handlers — everything in Chapters 10–11.
The supporting cast
Section titled “The supporting cast”- DOMContentLoaded (DCL) and load — document events (Chapter 9). Useful landmarks; poor proxies for experience. A page can fire
loadat 1 s and show nothing useful until 4 s (CSR), or fire it at 8 s because of a lazy carousel while users were happily reading at 1.5 s. - TBT — Total Blocking Time — a lab metric: the sum, over all long tasks between FCP and when the page becomes reliably interactive, of each task’s time beyond 50 ms. A 70 ms task contributes 20 ms; a 250 ms task contributes 200 ms. It’s the lab proxy for INP (you can’t measure real interactions in a scripted page load). Lighthouse weighs it heavily.
- Speed Index — a lab metric of how quickly the visible area visually fills in, computed from a filmstrip. Rewards progressive rendering.
- Long tasks — main-thread tasks over 50 ms (Chapter 11). Count and total duration.
- LoAF — Long Animation Frames — the modern successor to long tasks: frames that took over 50 ms to produce, with attribution — which scripts, which functions, how much was style/layout, how long the frame was blocked. Excellent for diagnosing INP in the field (Chromium).
- FPS — frames per second during animation or scrolling. Meaningful only while something is moving; consistency matters more than the average (Chapter 10).
- CPU time — how much main-thread (or total) CPU a page uses. “CPU ms per second” during steady state tells you how busy the page keeps the device while “idle.”
- JS heap size — memory used by JavaScript objects. Matters for low-memory devices, background tab discards and iOS process kills.
- DOM node count — a proxy for style/layout cost and memory.
The thresholds, in one table
Section titled “The thresholds, in one table”| Metric | Good | Needs improvement | Poor | Core Web Vital? |
|---|---|---|---|---|
| LCP | ≤ 2.5 s | 2.5–4.0 s | > 4.0 s | ✅ |
| INP | ≤ 200 ms | 200–500 ms | > 500 ms | ✅ |
| CLS | ≤ 0.1 | 0.1–0.25 | > 0.25 | ✅ |
| FCP | ≤ 1.8 s | 1.8–3.0 s | > 3.0 s | — |
| TTFB | ≤ 0.8 s | 0.8–1.8 s | > 1.8 s | — |
| TBT (lab) | ≤ 200 ms | 200–600 ms | > 600 ms | — (lab proxy for INP) |
The 75th-percentile rule
Section titled “The 75th-percentile rule”A page “passes” a Core Web Vital if the 75th percentile of real page loads meets the “good” threshold — evaluated separately for mobile and desktop. Why p75? It’s a compromise: the median would ignore a quarter of your users having a bad time; p95 would be dominated by outliers (a train going into a tunnel). p75 says: “three out of four visits are good.”
The implication most people miss: your p75 user is not you. If half your traffic is mid-range Android on 4G, your p75 is somewhere in the slow half of that population.
Lab vs. field
Section titled “Lab vs. field”Lab data comes from a controlled test: Lighthouse, the DevTools Performance panel, WebPageTest. One device profile, one network profile, one run (or a few), a scripted page load, no real user interactions. Great for debugging and regression testing: repeatable, detailed, available before you ship.
Field data comes from real users: CrUX (the Chrome User Experience Report — aggregated, anonymized data from Chrome users who opted in, over a rolling 28-day window, at origin and page level, shown in PageSpeed Insights and Search Console) and your own RUM (real-user monitoring, Chapter 17). Great for truth: real devices, networks, caches, behaviours. Lagging, aggregated, less detailed.
They disagree constantly, for good reasons:
- Devices and networks: the lab uses one emulated profile; the field is a messy distribution.
- Caches: lab runs are usually cold; real users often have warm caches, service workers, bfcache restores, prerendered pages.
- Interactions: the lab can’t measure INP (no real users clicking); it uses TBT as a proxy. CLS in the lab only captures shifts during load; the field captures shifts during the whole visit (scrolling, late ads).
- Content: the lab tests one URL in one state; real users see personalized content, A/B variants, cookie banners, logged-in states.
- LCP element: can differ by viewport size and content.
Rule: the field is the verdict; the lab is the microscope. When they disagree, believe the field about whether there’s a problem, and use the lab to find why.
Why localhost numbers lie
Section titled “Why localhost numbers lie”Measuring on localhost removes almost everything that makes the web slow:
- No network latency: a round trip to yourself is ~0 ms instead of 50–300 ms.
- No bandwidth limit: megabytes “download” instantly.
- No CDN, no TLS handshakes over distance, no DNS.
- A fast development machine: often 3–6× the single-core CPU performance of a mid-range Android phone, with a powerful GPU and lots of memory.
- Warm caches, often.
- Dev builds sometimes, which are slower in other ways (Chapter 10).
Localhost numbers are useful for relative comparisons of CPU work on the same machine (“this change made script time go from 85 to 40 ms per second”). They are nearly meaningless as absolute predictions of user experience. Hold that thought.
The author’s audit, decoded
Section titled “The author’s audit, decoded”Here is the real audit the author ran on her own project: a vanilla HTML/CSS/JS “glass” UI kit with lens and refraction effects (SVG and WebGL lens filters over a wallpaper canvas), plus a gallery of shadcn-style components, each rendered in its own iframe.
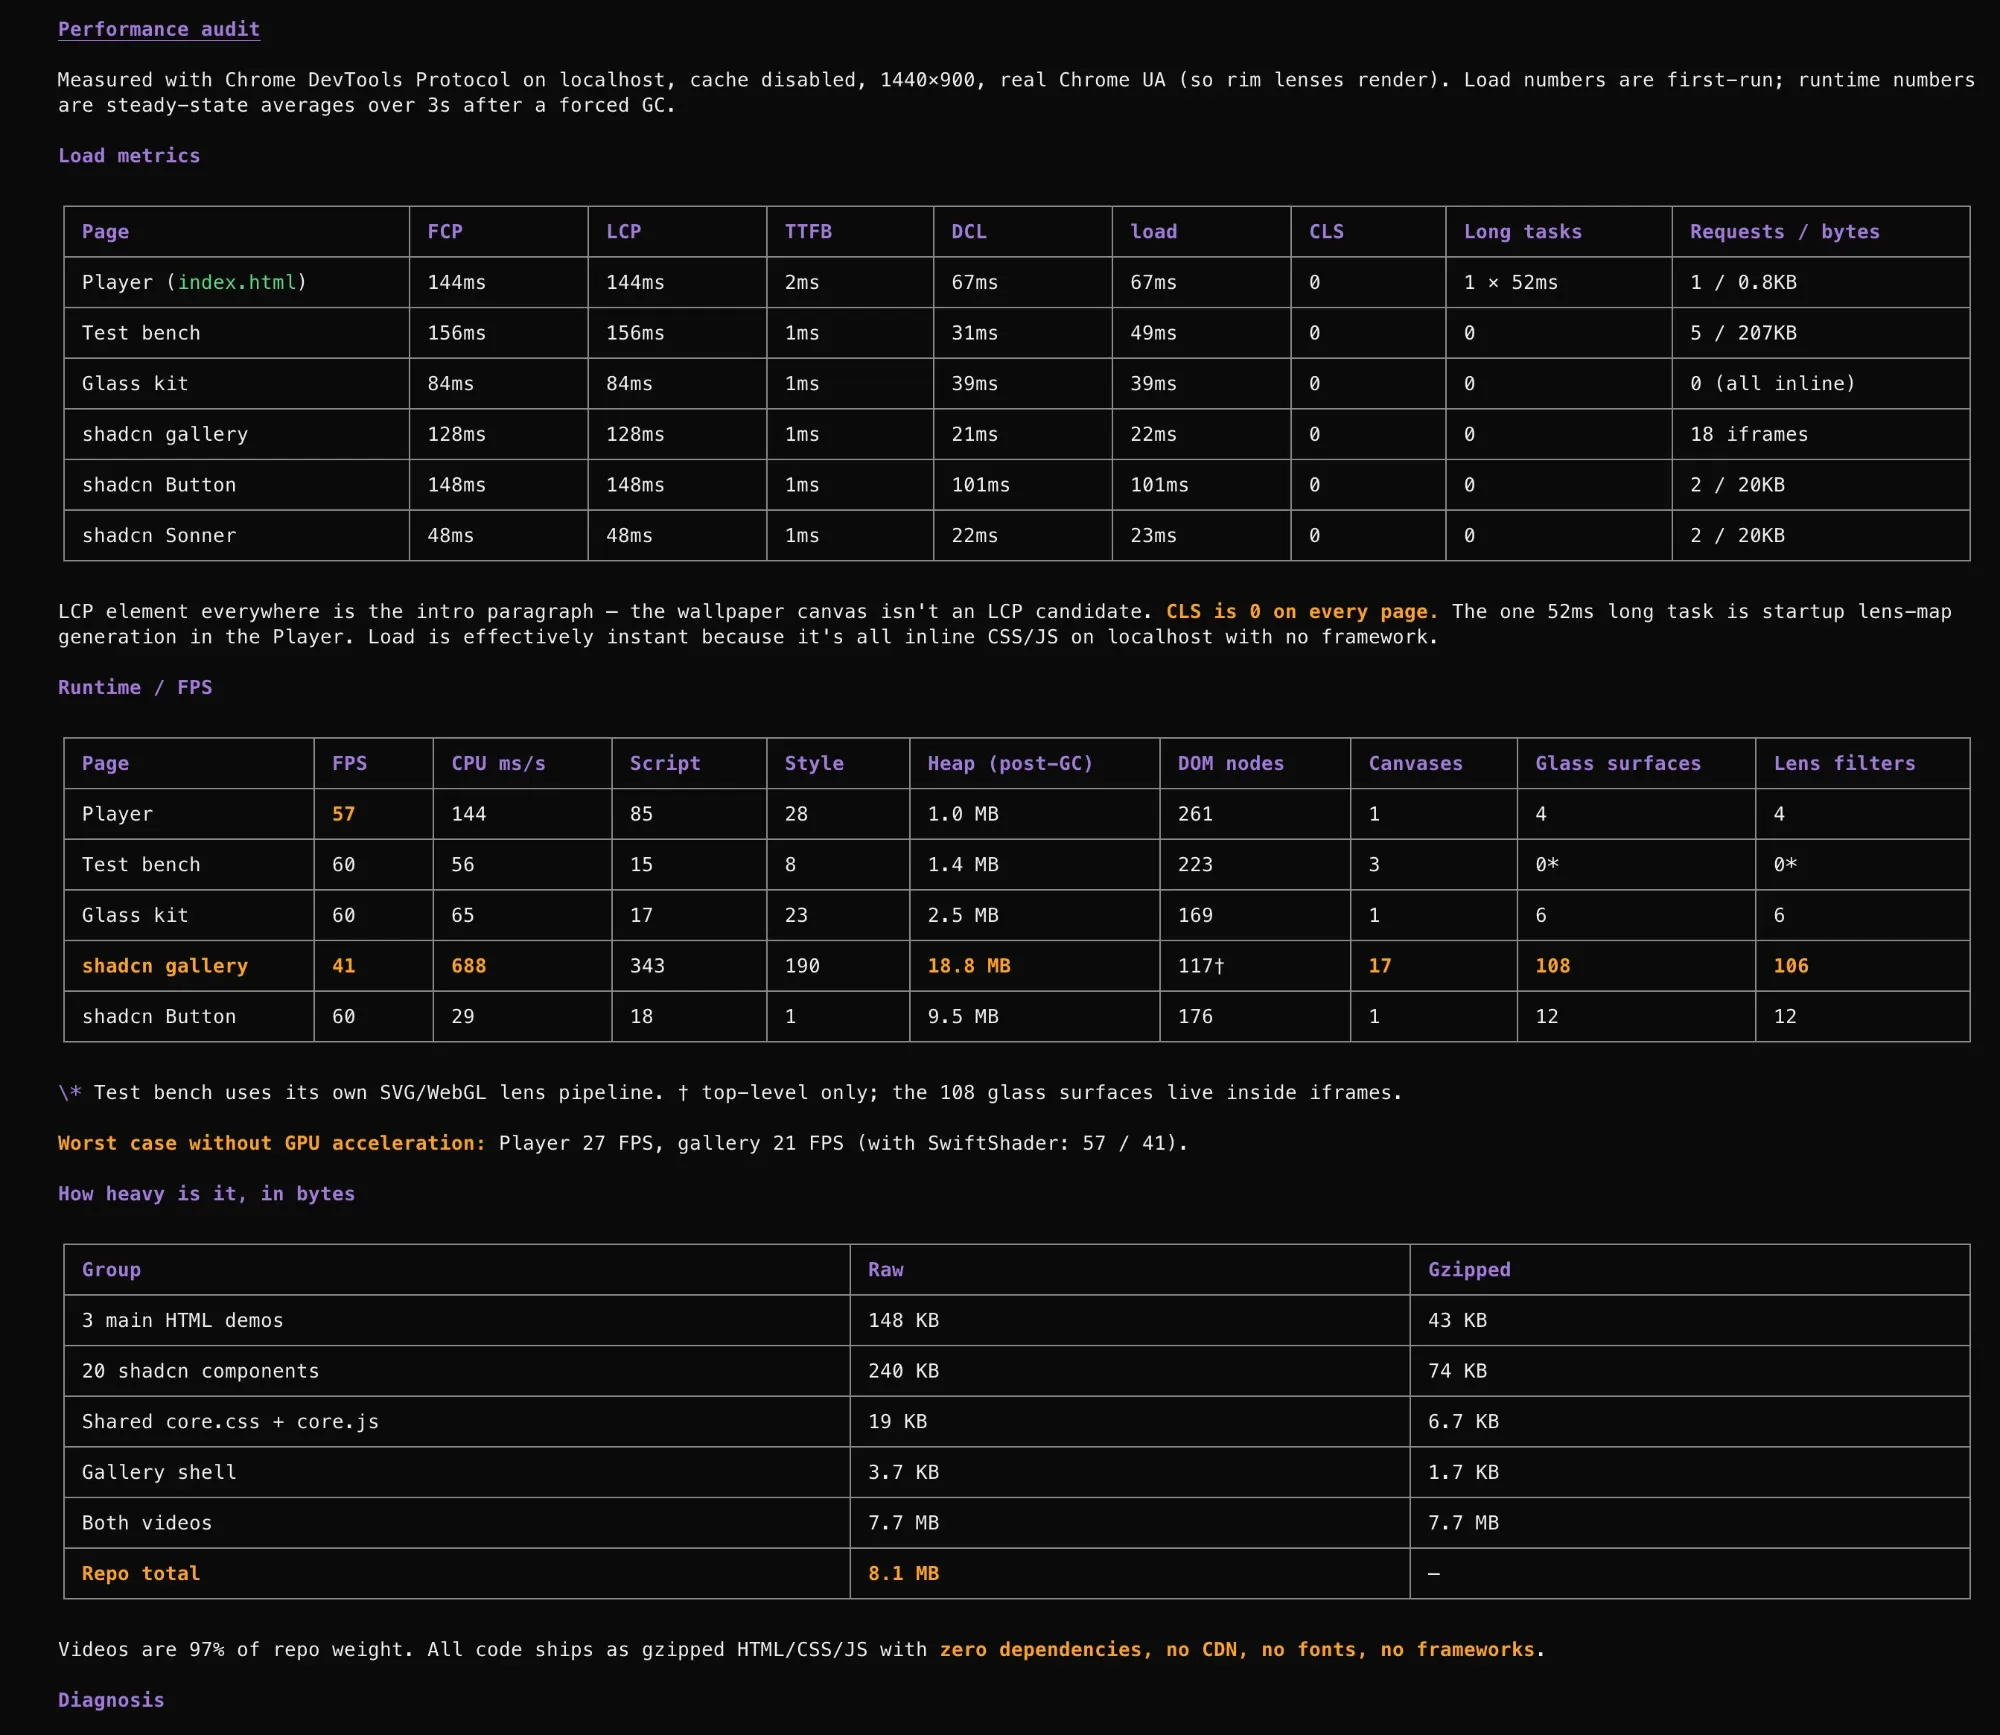
Her honest reaction was: “understood very little of what’s going on — are these numbers good enough, what is good, what is bad, how does this impact, what impact? What numbers should we aim for?” Let’s answer every part.
The measurement conditions, first
Section titled “The measurement conditions, first”Before reading any number, read how it was measured. This is the habit that separates seniors from everyone else.
- Chrome DevTools Protocol — automated measurement driving Chrome (like Lighthouse or Puppeteer). Fine.
- localhost — no network, no latency, no CDN. Every load number will be wildly optimistic (above).
- Cache disabled — good: first-visit loading, not warm-cache.
- 1440×900 — a desktop viewport. Not mobile. The LCP element and layout may differ on a phone.
- Real Chrome UA so rim lenses render — sensible: the effects that cost the most are on.
- Load numbers first-run — one run. Lab numbers vary run to run; always take the median of several (5+) runs before drawing conclusions about small differences.
- Runtime numbers: steady-state averages over 3 s after a forced GC — this is a careful choice: it measures what the page costs while sitting there “idle” (with effects animating), after clearing garbage so the heap reading is the live set. It’s a good methodology.
And implicitly: a fast development Mac with a capable GPU. Every runtime number is “on the best device she’ll ever test on.”
Table 1: Load metrics
Section titled “Table 1: Load metrics”| Page | FCP | LCP | TTFB | DCL | load | CLS | Long tasks | Requests / bytes |
|---|---|---|---|---|---|---|---|---|
| Player (index.html) | 144ms | 144ms | 2ms | 67ms | 67ms | 0 | 1 × 52ms | 1 / 0.8KB |
| Test bench | 156ms | 156ms | 1ms | 31ms | 49ms | 0 | 0 | 5 / 207KB |
| Glass kit | 84ms | 84ms | 1ms | 39ms | 39ms | 0 | 0 | 0 (all inline) |
| shadcn gallery | 128ms | 128ms | 1ms | 21ms | 22ms | 0 | 0 | 18 iframes |
| shadcn Button | 148ms | 148ms | 1ms | 101ms | 101ms | 0 | 0 | 2 / 20KB |
| shadcn Sonner | 48ms | 48ms | 1ms | 22ms | 23ms | 0 | 0 | 2 / 20KB |
Column by column:
- TTFB 1–2 ms. The server is the same machine. Meaningless as a prediction. On a real deployment it becomes DNS + TCP/QUIC + TLS + request + server time: realistically ~50–150 ms on a good desktop connection to a CDN, ~300–800 ms on Priya’s 4G, more without a CDN.
- FCP 48–156 ms, LCP = FCP everywhere. On localhost, everything paints almost immediately. LCP equals FCP because the first content painted (the intro paragraph) is also the largest eligible element. The wallpaper canvas is bigger but canvas isn’t LCP-eligible — so LCP here measures the paragraph, not when the visually dominant wallpaper appears. That’s a blind spot: if the wallpaper took 2 s to draw, LCP wouldn’t tell you.
- DCL / load 21–101 ms. Fast because everything is inline or tiny. The Button page’s 101 ms is the outlier — likely the effect setup script (lens map generation) running before the document finishes, since inline scripts block parsing. Worth a look, not a crisis.
- CLS 0 everywhere. Genuinely good, and likely to stay good in the field because layout doesn’t depend on late-arriving resources (all inline, no web fonts, no ads). Keep it that way: when you add images or video posters, give them dimensions.
- Long tasks: one 52 ms task in the Player — lens-map generation at startup. 52 ms is just over the 50 ms threshold on a fast Mac. On a mid-range phone with ~4–6× slower single-core performance, that becomes ~200–300 ms — a real long task that would block any tap during startup and add to TBT. It’s the first thing in this table that will matter in the field.
- Requests / bytes. Tiny. The gallery’s “18 iframes” is the interesting entry — 18 separate documents, which we’ll see in the runtime table.
Verdict on Table 1: the load story is excellent in principle — tiny, inline, no framework, no fonts, no CLS — but these specific numbers are not predictions. The architecture (small, inline, dependency-free) is exactly what you want for fast loading on real networks. The one item to fix is the 52 ms startup task.
What would they become on a real network and mid-range phone? A reasonable estimate for the Glass kit page served from a CDN to a mid-range Android on decent 4G (RTT ~80–150 ms): TTFB ~300–600 ms (connection setup + RTT), FCP/LCP ~0.7–1.2 s (TTFB + parsing inline CSS/JS at ~4× slower CPU + first paint). Still comfortably “good.” Pages with larger inline payloads (the Test bench’s 207 KB) cost more parse time. The Player’s lens generation shifts render and interactivity later. To know rather than estimate: deploy it, run WebPageTest on a real mid-range Android in Mumbai on 4G, and profile on a real phone (Chapter 17).
Table 2: Runtime / FPS
Section titled “Table 2: Runtime / FPS”| Page | FPS | CPU ms/s | Script | Style | Heap (post-GC) | DOM nodes | Canvases | Glass surfaces | Lens filters |
|---|---|---|---|---|---|---|---|---|---|
| Player | 57 | 144 | 85 | 28 | 1.0 MB | 261 | 1 | 4 | 4 |
| Test bench | 60 | 56 | 15 | 8 | 1.4 MB | 223 | 3 | 0* | 0* |
| Glass kit | 60 | 65 | 17 | 23 | 2.5 MB | 169 | 1 | 6 | 6 |
| shadcn gallery | 41 | 688 | 343 | 190 | 18.8 MB | 117† | 17 | 108 | 106 |
| shadcn Button | 60 | 29 | 18 | 1 | 9.5 MB | 176 | 1 | 12 | 12 |
* Test bench uses its own SVG/WebGL lens pipeline. † Top-level only; the 108 glass surfaces live inside iframes. Worst case without GPU acceleration: Player 27 FPS, gallery 21 FPS (with SwiftShader: 57 / 41).
Column by column:
- FPS — frames per second during steady state (effects animating). 60 is the display’s cap: the page delivers every frame. 57 means a few dropped frames per second — usually invisible, sometimes a subtle hitch. 41 means roughly a third of frames are missed: visible stutter.
- CPU ms/s — milliseconds of CPU time used per second of wall-clock time. 1,000 ms/s would mean one core fully busy. 144 ms/s means the page keeps ~14% of a core busy while “idle” — acceptable for an animated hero on desktop, but it’s battery and heat on a phone. 688 ms/s means ~69% of a core is busy all the time just to keep the gallery’s effects running.
- Script / Style — the breakdown of that CPU: time in JavaScript vs. style recalculation per second. The Player’s 85 ms/s of script is the lens animation loop; the gallery’s 343 ms/s script + 190 ms/s style is many animation loops and many style recalcs across 18 documents. (The remainder of CPU ms/s goes to layout, paint, compositing work and GC.)
- Heap (post-GC) — live JS memory after garbage collection. 1–2.5 MB is small. 9.5 MB for one Button page is surprising (see below). 18.8 MB for the gallery reflects many documents’ worth of state.
- DOM nodes — 117–261: tiny. DOM size is not the problem anywhere. (The gallery’s 117 is top-level only; each iframe has its own DOM.)
- Canvases, glass surfaces, lens filters — the cost drivers. One canvas and a handful of surfaces: fine. 17 canvases, 108 glass surfaces and 106 lens filters on one screen: that’s the bill.
The real problem: the shadcn gallery row
Section titled “The real problem: the shadcn gallery row”Everything else in the audit is good-to-fine. The gallery is where users would feel pain, and here is why each number is what it is.
1. 688 ms of CPU per second = the main thread is ~69% busy at steady state. Recall Chapter 11: input can only be handled when the main thread is free. If it’s busy ~70% of the time, a tap has a good chance of arriving mid-task and waiting (input delay), and then its handlers compete with the animation work (processing) and the next frame is already overloaded (presentation delay). That’s an INP risk, even with no long tasks reported — many medium tasks in a row are enough. And this is on a fast Mac. Scale by 4–6× for a mid-range phone and the main thread would need more than 100% of a core: it simply can’t keep up. Frame rate collapses, input queues.
2. 41 FPS = visible stutter. At 60 Hz, 41 FPS means about 19 missed frames per second — and they won’t be evenly spaced, so motion looks uneven (Chapter 10: pacing beats rate). Users perceive this as “laggy” or “heavy.”
3. Why so expensive? Multiplication. Each lens filter is a per-frame effect: an SVG filter chain or a WebGL pass that reads the content behind a glass surface, displaces and blurs it, and composites the result. Costs per surface include:
- Filter passes and offscreen buffers. Each blur or displacement renders into an intermediate texture, processes it (often in multiple passes), then composites. Cost scales with each surface’s area and the filter’s complexity.
- Per-frame re-raster. Because the content behind the glass (the animated wallpaper) changes every frame, nothing can be cached: every surface’s effect is recomputed every frame.
- Main-thread involvement. If the lens animation updates SVG filter attributes or CSS properties from JavaScript each frame, that’s script time plus style recalc time (the 343 + 190 ms/s), and possibly paint invalidation — main-thread work, not just GPU work.
- Multiple GL contexts. 17 canvases — likely one WebGL context per component/iframe. Each context has its own GPU state, shaders, textures and command stream; switching between them costs, and browsers cap active WebGL contexts per page (Chromium starts losing the oldest contexts beyond a limit — historically 16 — which is suspiciously close to 17). Chapter 20 covers this.
- 18 iframes = 18 documents. Each iframe is a complete document with its own DOM, style engine, layout, paint, JS globals, animation loops, and (same-origin iframes) shares the main thread with the parent; cross-site iframes may even get separate processes (Chapter 8). Eighteen of everything means eighteen style recalcs, eighteen rAF loops, eighteen copies of
core.js’s state, eighteen sets of GPU resources. Iframes are great for isolation in a showcase; they’re expensive as a rendering architecture.
4. 18.8 MB heap. Not alarming on desktop, but it’s the sum of 18 JS realms, each with its own copy of the shared code’s objects, lens maps (likely typed arrays), and per-surface state. On a 3–4 GB Android phone, with multiple GPU textures on top, memory pressure becomes real; on iOS, the tab could be killed.
5. The no-GPU numbers. “Without GPU acceleration: Player 27 FPS, gallery 21 FPS.” This is what happens when Chrome can’t use the GPU: on machines with blocklisted or buggy GPU drivers, in some virtual machines and remote desktops, or when hardware acceleration is disabled. All the raster and compositing work falls back to the CPU, and filters and WebGL are emulated in software (historically via SwiftShader, a CPU implementation of graphics APIs; note her parenthetical “with SwiftShader: 57 / 41” — on her fast CPU, SwiftShader’s WebGL path roughly matched the GPU numbers, while fully disabling GPU compositing cost much more). On a modest laptop CPU, these numbers would be far lower. This is the experience a real fraction of users get — corporate laptops, older machines, some Chromebooks — and it’s the strongest argument for graceful degradation: detect weak or software rendering and fall back to static glass (Chapter 17).
The 9.5 MB Button page
Section titled “The 9.5 MB Button page”A single Button page: 176 DOM nodes, 12 glass surfaces, 12 lens filters, 1 canvas — and 9.5 MB of heap. For comparison, the Glass kit (6 surfaces, 169 nodes) is 2.5 MB. That’s disproportionate. Likely causes:
- Lens maps stored as typed arrays per surface — e.g., a displacement map as a
Float32Arrayof width × height × channels. A 512×512 RGBA float map is 4 MB; even 8-bit maps add up across 12 surfaces. - Precomputed lookup tables generated at startup (remember the Player’s 52 ms “lens-map generation”) and kept around.
- Image data read back from canvases (
getImageData) and retained. - Duplicated buffers: a JS-side copy and an uploaded GPU texture, where the JS copy could be dropped after upload.
How to find out: DevTools → Memory → Heap snapshot. Sort by Retained size. Look for large ArrayBuffer/Float32Array/Uint8ClampedArray entries and check their retainers (which object holds them). Take snapshots at different points (after load, after interaction) and compare. If lens maps are identical across surfaces of the same size, generate one and share it; if they’re only needed to build a texture, upload and release; if they can be smaller (8-bit instead of float, lower resolution with GPU filtering), shrink them.
Table 3: Weight in bytes
Section titled “Table 3: Weight in bytes”| Group | Raw | Gzipped |
|---|---|---|
| 3 main HTML demos | 148 KB | 43 KB |
| 20 shadcn components | 240 KB | 74 KB |
| Shared core.css + core.js | 19 KB | 6.7 KB |
| Gallery shell | 3.7 KB | 1.7 KB |
| Both videos | 7.7 MB | 7.7 MB |
| Repo total | 8.1 MB | — |
The code is small and compresses well (~3–4× with gzip; Brotli would do a bit better). Videos are 97% of the weight and don’t compress at all — video is already compressed by its codec; gzip finds nothing left to squeeze (Chapter 6). The bytes question isn’t “how do we compress video more” but “how do we serve video properly”:
- Encode well: a modern codec (H.264 for universal support; AV1 or VP9/HEVC where supported, via multiple
<source>elements), sensible resolution and bitrate for the display size — a background loop rarely needs more than 720p at a modest bitrate. Often 5–10× smaller than an unoptimized export. - Don’t download it until needed:
preload="none"(ormetadata), a lightweight poster image (which can also be the LCP element — give it dimensions and priority), and lazy-loading the<video>with IntersectionObserver when it approaches the viewport. - Respect the user: don’t autoplay heavy video on cellular data or with
prefers-reduced-motion; checknavigator.connection.saveDatawhere available. - For longer videos, adaptive streaming (HLS or DASH): the video is split into segments at several bitrates; the player switches quality with the network. That’s what YouTube does, and what a hosted video service gives you.
- Host it on a CDN with correct caching and range-request support.
What “good” looks like: the target table
Section titled “What “good” looks like: the target table”| Metric | Target: mobile (mid-range Android, 4G, p75) | Target: desktop (p75) | Author’s status |
|---|---|---|---|
| TTFB | ≤ 0.8 s | ≤ 0.6 s | Unknown (localhost); fine with a CDN |
| FCP | ≤ 1.8 s | ≤ 1.0 s | Likely good |
| LCP | ≤ 2.5 s (aim ≤ 2.0) | ≤ 1.5 s | Likely good — but canvas blind spot |
| CLS | ≤ 0.1 (aim 0) | ≤ 0.1 (aim 0) | ✅ 0 |
| INP | ≤ 200 ms (aim ≤ 150) | ≤ 100 ms | ⚠️ Gallery at risk (~69% CPU busy) |
| Long tasks at startup | none > 50 ms on the target device | none > 50 ms | ⚠️ Player 52 ms on a Mac → ~250 ms on a phone |
| Steady-state CPU while idle | ≤ ~100–150 ms/s on desktop; less on mobile; ~0 when nothing is visible | ≤ ~100 ms/s | ⚠️ Player 144; ❌ gallery 688 |
| Animation FPS | steady 60 (or display rate), no long hitches | steady 60+ | ✅ most pages; ❌ gallery 41 |
| No-GPU fallback | usable (≥ 30 FPS) or static fallback | same | ❌ 21–27 FPS |
| JS heap | ≤ ~10 MB per page on mobile | ≤ ~25 MB | ✅ most; ⚠️ Button 9.5 MB for one button |
| Page weight above the fold | ≤ ~200 KB critical (compressed) | ≤ ~500 KB | ✅ code; ❌ video if loaded eagerly |
The prioritized fix list
Section titled “The prioritized fix list”In order of user impact per unit of effort:
- Pause what isn’t visible. Use IntersectionObserver to stop each glass surface’s animation loop and filter updates (and pause videos and canvases) when it’s off-screen, and pause everything on
visibilitychange→ hidden. In a gallery, most surfaces aren’t visible at any moment. Expect a large drop in CPU ms/s immediately. - Lazy-mount the gallery. Don’t instantiate all 18 iframes at once. Render a static preview (a screenshot or static glass) and mount the live component when it scrolls into view or on hover/click. Fewer documents, fewer contexts, less memory.
- Share one WebGL context (or one canvas) across surfaces. Instead of 17 canvases with 17 contexts, render all lens effects from one context — either one full-page canvas with each surface as a viewport/scissor region, or one offscreen context rendering into textures/bitmaps for each surface. One set of shaders and shared textures, one command stream, no context-limit evictions (Chapter 20).
- Cap live filters. A budget like “at most N live lens surfaces animating at once; the rest render a cached static frame.” Freeze the background behind glass when nothing is interacting — a static backdrop lets the browser cache the filtered result.
- Move per-frame work off the main thread. If the wallpaper canvas animates continuously, render it in a worker with OffscreenCanvas, so its script time stops competing with input (Chapter 11). Avoid updating SVG filter attributes from JS every frame; prefer GPU-side animation (uniforms in a shader) or CSS animations of compositor-friendly properties.
- Fix the startup long task. Generate lens maps lazily (per surface on first visibility), in a worker, or precompute them at build time and ship them as compact images; split generation into chunks with
scheduler.yield(). - Degrade gracefully. Detect software rendering (WebGL renderer string mentioning SwiftShader, or failure to get a WebGL context), weak devices (
hardwareConcurrency,deviceMemory),prefers-reduced-motionandprefers-reduced-transparency, and serve static glass (a pre-blurred backdrop image, no live filter) in those cases (Chapter 17). - Shrink the Button page’s heap. Heap snapshot → find the big typed arrays → share or release them.
- Serve video properly. Re-encode, poster +
preload="none"+ lazy load, multiple codecs, no autoplay on Save-Data/reduced motion. - Measure for real. Deploy to a CDN; run WebPageTest on a mid-range Android; profile on a real phone over USB; add
web-vitalsRUM (Chapter 17). Replace estimates with field data.
Reading a Lighthouse report
Section titled “Reading a Lighthouse report”Lighthouse runs a lab page load (by default emulating a mid-range phone on a throttled network, with simulated throttling), then reports:
- Performance score (0–100) — a weighted blend of lab metrics: FCP, Speed Index, LCP, TBT and CLS, each converted to a score via curves derived from real-world data. TBT and LCP and CLS carry most of the weight. The score is a summary for humans; it moves a few points run to run; it’s not a Core Web Vitals assessment (that’s field data) and not a ranking factor.
- Metrics — the raw values. Read these, not the score.
- Insights / diagnostics — specific findings: render-blocking resources, LCP breakdown and discovery problems, unused JavaScript, image sizing, layout shift culprits, long main-thread tasks, third-party impact. Each links to the evidence.
- Passed audits — what you’re already doing right.
The best use of Lighthouse: in CI as a regression alarm (Chapter 3), and locally as a checklist generator. The worst use: chasing 100 on a laptop and declaring victory.
Performance budgets
Section titled “Performance budgets”A performance budget is a limit the team agrees not to exceed. Three kinds:
- Quantity budgets — JS ≤ 170 KB compressed on the critical path; total page weight ≤ 1 MB; ≤ 2 third-party origins; images ≤ 200 KB above the fold.
- Timing budgets — LCP ≤ 2.5 s and INP ≤ 200 ms at p75 on mobile (field); lab TBT ≤ 200 ms on the CI profile.
- Rule-based budgets — Lighthouse performance ≥ 90 in CI on key pages; no new long tasks > 100 ms on the reference device.
Quantity budgets are easy to enforce in CI (they’re deterministic: size-limit, bundle analyzers) and correlate with timing. Timing budgets are what users feel. Use both: quantity budgets to stop regressions at the PR, timing budgets in the field to know you’re actually good. Chapter 18 wires them into the pipeline; Chapter 24 shows how to defend them to leadership.
What you now know
Section titled “What you now know”You can handle performance statistics with honest skepticism; define every metric from TTFB to LoAF with its threshold, what users feel and what usually causes it; break LCP into four sub-parts and INP into three; explain CLS session windows; apply the p75 rule; explain why lab and field disagree and why localhost lies; read a Lighthouse report for what matters; set budgets — and you can take a table of numbers like the author’s audit, say which are good, which are meaningless, which are dangerous and why, and produce a target table and a prioritized fix list.
That’s the conversation in the design review: “Our LCP is fine on your laptop and 4.1 s at p75 on mobile field data. Here’s the breakdown, and here’s the fix.”
Self-quiz
Section titled “Self-quiz”1. What are the three Core Web Vitals and their “good” thresholds?
LCP ≤ 2.5 s, INP ≤ 200 ms, CLS ≤ 0.1 — at the 75th percentile, mobile and desktop separately.
2. Name the four LCP sub-parts.
TTFB, resource load delay, resource load duration, element render delay.
3. Why isn’t the author’s wallpaper canvas the LCP element?
Canvas elements aren’t LCP-eligible, so the largest eligible element (the intro paragraph) is reported.
4. What does 688 CPU ms/s mean?
About 69% of one CPU core is busy every second just running the page at steady state — little headroom for input, high INP risk, and on slower devices it exceeds a whole core.
5. Why did INP replace FID?
FID measured only the input delay of the first interaction; INP measures full latency (delay + processing + presentation) across all interactions.
6. Why doesn’t gzip shrink the author’s videos?
Video codecs already compress the data; there’s no redundancy left for general-purpose compression.
7. Lab says LCP 1.2 s; CrUX says p75 LCP 3.6 s. Which is right?
Both measured correctly; the field is the verdict for users. Use the lab to diagnose why real users are slower (devices, networks, discovery, content differences).
Exercises
Section titled “Exercises”Warm-up 1. Grade them. LCP 2.8 s, INP 180 ms, CLS 0.02 at p75 mobile. Does the page pass Core Web Vitals?
Solution
No — LCP is “needs improvement.” All three must be good to pass.
Warm-up 2. Find the slice. LCP 3.4 s = TTFB 0.6 s + load delay 1.9 s + load duration 0.5 s + render delay 0.4 s. What’s the problem and the likely fix?
Solution
Discovery: the image starts loading 1.9 s after the HTML. Likely lazy-loaded, a CSS background or JS-inserted. Put it in HTML, remove lazy, add fetchpriority="high" or preload.
Warm-up 3. TBT arithmetic. Long tasks of 60, 120 and 45 ms after FCP. What’s TBT?
Solution
10 + 70 + 0 = 80 ms.
Warm-up 4. Read the audit. Which single row of the author’s runtime table would you fix first and why?
Solution
The shadcn gallery: 41 FPS, ~69% CPU, 17 canvases, 106 live filters — the only row users would clearly feel, and the one that gets dramatically worse on weaker hardware.
Lab 5. Re-run the audit, step by step. If you have a glass/effects project (or use Lumen’s WebGL hero later), measure FPS, CPU ms/s, heap and canvases. Then apply fix 1 (pause off-screen) and re-measure; fix 2 (lazy-mount); fix 3 (shared context); fix 4 (cap filters). Record a before/after table for each step.
Method
Use the Performance panel or the DevTools Protocol with the same conditions every time (same viewport, 3 s steady state after forced GC, 5 runs, median). Keep a spreadsheet; the deltas tell the story.
Lab 6. LCP breakdown on Lumen. Use the Performance panel’s LCP insight on Lumen’s essay page (4× CPU, Slow-4G-like network). Record the four sub-parts. Fix the biggest; repeat.
Expected outcome
Load delay should shrink to near zero once the hero is discoverable and prioritized.
Lab 7. Lab vs field. Deploy Lumen; check PageSpeed Insights (lab + any field data); add a small RUM snippet that logs LCP/INP/CLS to the console. Compare lab and your own field readings from a real phone.
Hint
The web-vitals library makes the field side a few lines (Chapter 17).
Lab 8. Heap detective. In a page with typed arrays (or the author’s Button page), take a heap snapshot, sort by retained size, and identify the top three retainers.
Expected outcome
Large ArrayBuffers with clear retainer paths, and a plan to share, shrink or release them.
Staff 9. Write the audit memo. Turn the author’s audit into a one-page memo for a mixed audience (designers, engineers, a PM): what’s good, what’s at risk, what we’ll do, how we’ll know.
Model outline
Headline (fast to load, expensive to run); evidence (two numbers: 688 ms/s, 41 FPS); user impact (stutter, slow taps on phones, no-GPU users); plan (pause, lazy-mount, share context, cap, degrade); measurement plan (before/after table, real-device test, RUM); ask (one sprint).
Staff 10. Defend the budget. Propose performance budgets for a design system with live glass effects, and explain each number to a skeptical designer.
Model answer
Live animated surfaces per viewport ≤ N; steady-state CPU ≤ 100 ms/s on the reference laptop; 60 FPS on the reference mid-range phone for one hero effect; static fallback below capability thresholds. Each number traced to a user outcome (smoothness, battery, INP headroom) and to measurements.